|
|
Post by ka9q on Jul 28, 2010 14:38:04 GMT -4
Yes, I believe you're right about pumps but we don't know the details of the F-1 turbopumps.
As I recall, the Saturn V flight reports discuss things like pump speed and inlet and outlet pressures. It might be worth scanning them for ideas. You have copies, right? They're separate from the mission reports.
|
|
Bob B.
Bob the Excel Guru?
Posts: 3,072
|
Post by Bob B. on Jul 28, 2010 14:45:19 GMT -4
As I recall, the Saturn V flight reports discuss things like pump speed and inlet and outlet pressures. It might be worth scanning them for ideas. You have copies, right? They're separate from the mission reports. I'm not sure if I have that information or not. I'll have to look through my documentation. |
|
|
|
Post by ka9q on Jul 28, 2010 15:46:14 GMT -4
The reports you're looking for are titled, e.g., Saturn V Launch Vehicle Flight Evaluation Report - AS-506 - Apollo 11 Mission, and come out of Marshall SFC. The report number for that particular report is NASA TM X-62558.
|
|
|
|
Post by ka9q on Jul 28, 2010 15:56:28 GMT -4
I think I found the information you were looking for. On page 5-4 of that report, the upper right plot in Figure 5-3 shows stage flow rate vs time, and the upper left graph shows thrust vs time. Thrust rises from about 34.7 MN to 40 MN at inboard cutoff, and flow rate increases from 13,200 kg/s to 13,420 kg/s or thereabouts at inboard cutoff, by eye from the plots. The plots also give mixture ratio and Isp as a function of time during S-IC flight.
The whole report is full of stuff like that. You really need it for your analysis.
|
|
Bob B.
Bob the Excel Guru?
Posts: 3,072
|
Post by Bob B. on Jul 28, 2010 16:38:56 GMT -4
I think I found the information you were looking for. On page 5-4 of that report, the upper right plot in Figure 5-3 shows stage flow rate vs time, and the upper left graph shows thrust vs time. Thrust rises from about 34.7 MN to 40 MN at inboard cutoff, and flow rate increases from 13,200 kg/s to 13,420 kg/s or thereabouts at inboard cutoff, by eye from the plots. The plots also give mixture ratio and Isp as a function of time during S-IC flight. I'm pretty darn close to those numbers. I've got the thrust rising from 34.5 MN to 39.8 MN and the flow rate from 13,230 kg/s to 13,348 kg/s. I feel pretty good about that. I'm not sure it's worth re-doing to whole simulation, in fact, it might be good not to. If I can find the report you're referring to, perhaps the better thing to do is to write an appendix with the new information showing how close I got. That might actually be more impressive than force feeding the new data into the simulation because it provides after the fact confirmation that my logic and methods were essentially correct. |
|
Bob B.
Bob the Excel Guru?
Posts: 3,072
|
Post by Bob B. on Jul 28, 2010 17:34:28 GMT -4
I probably would have been even closer to those Flight Evaluation Report flow rates if not for a couple short cuts I took to make the progamming of the simulation easier.
First, I figured the flow rate increasing by a straight line function from the 13,230 kg/s at liftoff to 13,348 kg/s at inboard cutoff. Had I done it as a function of acceleration (which I thought would be more accurate but more difficult to program), the flow rate at cutoff would have been higher than my 13,348 number, which is what the real data shows.
Second, I determined the starting flow rate as needed to attain the engine performance necessary to match the altitude and space-fixed velocity of Apollo 11 at a couple known data points (Mach1 at 66.3 s and Max q at 83.0 s). What I didn’t factor into this was that I discounted the initial space-fixed velocity (Earth rotation) by about 19 m/s to account for the launch azimuth. Had I not done this, I might have been a little too fast at the points I was trying to match, which means I would have needed to lower the initial flow rate a bit more than I did. Again, this is what the real data shows.
|
|
|
|
Post by PeterB on Jul 30, 2010 10:55:07 GMT -4
Incidentally, the AFJ specifies different PU ratios than the ones you use. What does AFJ say? For Apollo 15, it says 5.5:1 to 4.8:1. |
|
|
|
Post by capricorn1 on Jul 13, 2011 17:00:36 GMT -4
Can I point something out........the first diagram on the TLI page shows the journey along the plane of the equator. Didn't they do it at 28 degrees, to skip around the VAB?
|
|
Bob B.
Bob the Excel Guru?
Posts: 3,072
|
Post by Bob B. on Jul 13, 2011 17:24:25 GMT -4
Can I point something out........the first diagram on the TLI page shows the journey along the plane of the equator. Didn't they do it at 28 degrees, to skip around the VAB? Are you referring to this image?  I find it difficult to tell what the inclination is in that image, but it does look to be close to zero. I show this image because it is a good example of a poorly drawn illustration. My point is that many of the illustrations we see do a poor job of depicting what the orbit actually looks like. The purpose of my web page is to show the true size and orientation of the orbit. You're correct about the inclinations of the orbits, though they were actually inclined more than 28 degrees. Most of the missions launch into parking orbits around 32.5 degrees, which was then reduced to around 31 degrees during the TLI burn. A few missions were a little less than this. |
|
|
|
Post by capricorn1 on Jul 13, 2011 18:36:55 GMT -4
Can I point something out........the first diagram on the TLI page shows the journey along the plane of the equator. Didn't they do it at 28 degrees, to skip around the VAB? Are you referring to this image? I find it difficult to tell what the inclination is in that image, but it does look to be close to zero. I show this image because it is a good example of a poorly drawn illustration. My point is that many of the illustrations we see do a poor job of depicting what the orbit actually looks like. The purpose of my web page is to show the true size and orientation of the orbit. You're correct about the inclinations of the orbits, though they were actually inclined more than 28 degrees. Most of the missions launch into parking orbits around 32.5 degrees, which was then reduced to around 31 degrees during the TLI burn. A few missions were a little less than this. Ahhh I see. Perhaps from a layman's point of view...namely me....a correct one underneath would be applicable demonstrating what it should look like? eta: I should add, that as non technical person, my first reading was to read the header, then skip to the first picture. Obviously I didn't even read the opening paragraph...and I'm not sure that it is a unique thing for people coming accross something they don't quite understand to do something similar. Perhaps it's just me  |
|
|
|
Post by lukepemberton on Jul 15, 2011 23:17:59 GMT -4
Interesting diagrams with the LEO parking orbit and TLI. I have shared some PMs with ka9q/Philwebb59 about the TLI, and looked through your webpages on the subject Bob. Am I correct in thinking that the TLIs occured somewhere over the Pacific, so Apollo began climbing over the VABs around Canada? This would mean that since the VABs are orientated with respect to the geomagnetic axis, the TLI orbit was in plane at 40-45 degrees to the plane of the VABs. I know this is not a precise description, and we accused CTers of handwaving, but I am thinking of describing this to a lay audience - such as children.
|
|
|
|
Post by Kiwi on Jul 16, 2011 10:32:33 GMT -4
Am I correct in thinking that the TLIs occured somewhere over the Pacific, so Apollo began climbing over the VABs around Canada? Search for Apollo Earth Orbit charts (AEOs) for the lunar missions. I have one for Apollo 13, first edition, 3 March 1970, which I could email to you if you can't find it. It is 732 KB and 4119 x 1317 pixels, and I may have found it at the Honeysuckle Creek website. Shown on it are the projected ground tracks for 72- and 96-degree launch azimuths for the two orbits, and for the 72-degree launch azimuth it shows the first 24 hours of ground track following TLI. Ideally you'd want an "after" chart of the actual ground track, but on this one TLI starts over Queensland, Australia, southwest of Townsville, and the ground track pretty much follows a standard orbit for the first four hours, then reverses at about 105 degrees west, 32 degrees north, southeast of El Paso, no doubt due to the spacecraft's translunar trajectory and the earth's rotation. From that point it forms almost a straight line and heads west and reaches roughly the border between Algeria and Mali at the end of the first 24 hours. It dips only about 8 degrees to a little under 24 degrees north. For the 96-degree launch azimuth, TLI would start over the Indian Ocean at about 97 degrees east, 22 degrees south. Like you, I thought the early part of the translunar ground track might go much further north, which the Apollo 11 photos of earth seem to show. |
|
Bob B.
Bob the Excel Guru?
Posts: 3,072
|
Post by Bob B. on Jul 16, 2011 16:13:31 GMT -4
Interesting diagrams with the LEO parking orbit and TLI. I have shared some PMs with ka9q/Philwebb59 about the TLI, and looked through your webpages on the subject Bob. Am I correct in thinking that the TLIs occured somewhere over the Pacific, so Apollo began climbing over the VABs around Canada? This would mean that since the VABs are orientated with respect to the geomagnetic axis, the TLI orbit was in plane at 40-45 degrees to the plane of the VABs. I know this is not a precise description, and we accused CTers of handwaving, but I am thinking of describing this to a lay audience - such as children. You’re pretty much right on. Fortunately my original spreadsheets from a couple years ago has all the ground track information, so I was able to pretty easily produce the following chart. The blue line is the ground track of Apollo 11, i.e. the path inscribed on Earth’s surface by a line connecting the center of Earth to the spacecraft. The leftmost end of the curve is the position of Apollo 11 and the end of the TLI burn. The spacecraft then tracked eastward with the red markers indicating 5-minute increments. The chart includes the first 90 minutes of translunar flight because after this time the spacecraft was essential pass the outer edge of the VARB. The green curve at the bottom is the geomagnetic equator. 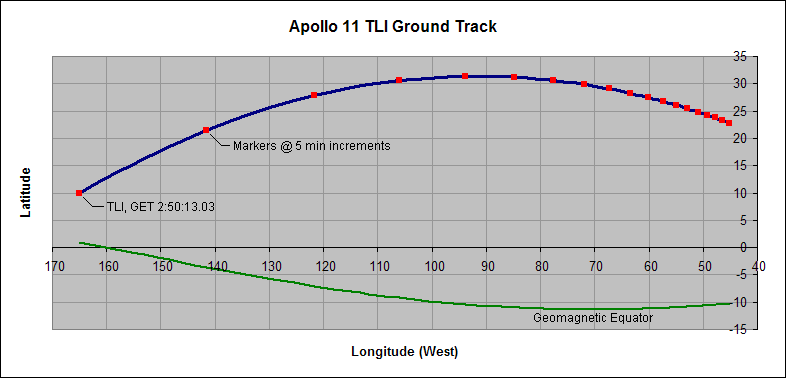 I’ve also superimposed the ground track on a map of the world: 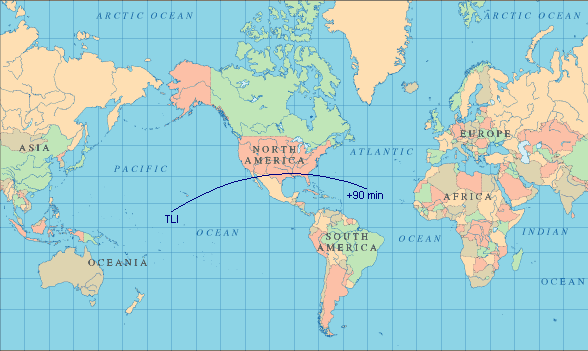 The maximum angular separation between Apollo 11 and the geomagnetic equator occurred at the 25-minute mark when the separation was 42.2 degrees. The 25-minute mark also just happens to be the time that Apollo 11 passed the most intense part of the outer radiation belt. Also note that, although the angular separation began to decrease, the linear distance between Apollo 11 and the geomagnetic plane continued to increase. Kiwi, how does this check against your information? |
|
|
|
Post by lukepemberton on Jul 16, 2011 16:21:28 GMT -4
Thanks for confirming that Bob, along with your figures. Thanks to Kiwi too.
|
|
|
|
Post by ka9q on Jul 20, 2011 17:30:08 GMT -4
Like you, I thought the early part of the translunar ground track might go much further north, which the Apollo 11 photos of earth seem to show. It can't go any farther north (or south) than the inclination of the parking orbit because TLI was an in-plane maneuver. Anything else would have been terribly inefficient. Offhand (check me on this) a typical Apollo parking orbit had an inclination of around 38 degrees. It varied in real time through the launch window to keep the moon in the orbital plane as the earth rotated. That means the spacecraft never passed 38N during its transfer to the moon. It attained its high geomagnetic latitude for VAB avoidance purposes by passing through those altitudes over the southeastern USA where the geomagnetic latitude is much higher than the geodetic (ordinary map) latitude. If anyone analyzes this today keep in mind that the earth's magnetic poles are moving very rapidly; they're no longer where they were in 1969. |
|


